After reading the chapters and completing exercises in Unit 1, the reader will be able to:
Road safety is an important part of everyday life. Across the nation, people use roads and sidewalks to get to work, school, stores, and home. Public agencies work to ensure that people arrive at their destination without incident.
However, not every trip is without incident. Deaths and injuries resulting from motor vehicle crashes represent a significant public health concern. The World Health Organization (WHO) estimates that motor vehicle crashes kill more than 1 million people around the world each year, and seriously injure as many as 20 to 50 million.1 These crashes affect all road users, from vehicle drivers and passengers to pedestrians, bicyclists, and transit users.
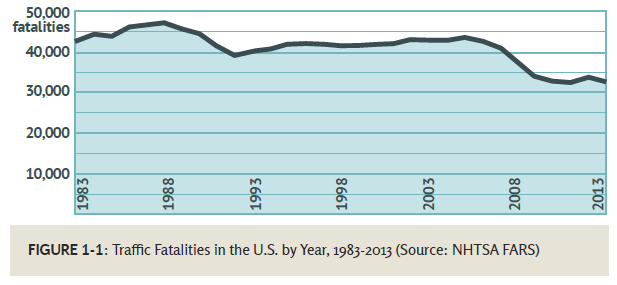
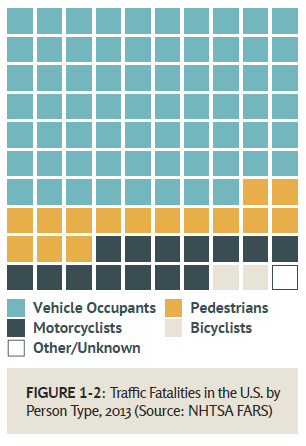
Though road safety in the U.S. has steadily improved over time, it remains a priority for transportation agencies, legislators, and advocacy organizations. Over the past 10 years in the U.S., an average of approximately 37,000 people were killed each year and an estimated 2.3 million were injured in motor vehicle crashes.2 While many of these deaths and injuries are sustained by motor vehicle passengers and drivers, they also impact motorcyclists, pedestrians, bicyclists, and users of transit vehicles. This challenge requires a comprehensive approach to improving safety, involving numerous stakeholders and decision makers from a variety of perspectives and disciplines.
The number of crashes occurring per year or other unit of time.
The number of crashes normalized by a particular population or metric of exposure.
Measured by the types of injuries sustained to the people involved in the crash.
An absolute statement about the safety of a location based only on its adherence to a particular set of design standards and related criteria.
Historical and long-term objective safety of a location based on crash data.

In the simplest terms, safety can be defined as the absence of risk or danger. Focusing this term to address transportation, road safety can be characterized by the ability of a person to travel freely without injury or death. A perfectly safe transportation system would not experience crashes between various road users. Though absence of all crashes is an optimal condition, and many transportation agencies have a goal of zero deaths on the road, the reality is that people continue to get injured or killed on streets and highways across the nation. The challenge posed to the road safety field is to minimize the frequency of crashes and the resulting deaths and injuries using all currently available tools, knowledge, and technology. This challenge is made more complex due to the multitude of factors influencing safety, from infrastructure to vehicle design to human behavior.
Road safety professionals typically measure safety by the number and rate of crashes and by the severity of those crashes. Crash frequency, or the number of crashes occurring per year or other unit of time, is another commonly used metric. Crash rates are numbers of crashes normalized by a particular population or metric of exposure. Commonly cited crash rates include crashes per 100,000 people living in a particular State, city or country. Some crash rates present crash numbers per miles traveled or licensed drivers. Crash outcomes can be measured by the types of injuries sustained to the people involved in the crash, typically categorized by fatalities and injury severity. Focusing on crashes that result in severe injuries and fatalities is one strategy that agencies use to prioritize their safety activities.
In addition to the measures described above, safety professionals can use surrogate measures, such as conflicts (near misses), avoidance maneuvers, and the time to collision if no evasive action is taken, to determine the level of safety risk and identify specific problems. Safety problems may exist even in locations that do not have a demonstrated history of crashes, just as someone who smokes is at higher risk for lung cancer even if no cancer has yet been detected. This can be especially true for non-motorized road user safety, such as pedestrians and bicyclists, since crashes involving these road users may be infrequent and appear random at first sight. In such locations where crashes are sparse or distributed across the system, safety professionals can use surrogate measures to fill the gaps and assess the road’s level of risk. Observing traffic at an intersection, for example, may reveal a pattern of near misses and other conflicts between vehicles and pedestrians. This pattern may not appear in crash data, but can be a valuable source of information to highlight the potential for safety risk.
Safety perception is also an important consideration for travel choices. There are a number of reasons why someone may or may not choose a particular route to drive, walk or bike. Pedestrians who perceive an intersection to be unsafe may cross in a midblock location, where they are more easily able to find a gap in traffic. Motorists may feel uneasy about making a left turn across multiple lanes of traffic, so they may choose to turn right and travel out of their way to perform a U-turn instead. Safety perception impacts road user decisions but is not easily understood by looking at crash data. Safety professionals can use surveys, driving simulators, and other modern technologies to understand the safety perception of road users.
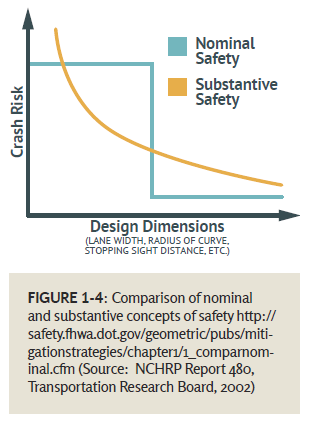
Evaluating the safety of a particular network, corridor or intersection requires an understanding of both nominal and substantive safety. Originally introduced by Dr. Ezra Hauer,3 these terms offer a helpful framework for assessing the safety of a particular location. Decades of research and evaluation in the field of road safety have revealed a wealth of knowledge concerning the proper designs and policies that contribute to the safety of a particular location. Roadways constructed according to the best and latest recommended research and design standards are said to be nominally safe. Nominal safety is an absolute statement about the safety of a location based only on its adherence to a particular set of design standards and related criteria. A road that was nominally safe when it was first opened to traffic may become nominally unsafe when the roadway design standards change, even though the road’s crash performance has not changed.
While nominal safety considers the design of a road, it does not incorporate any information about the frequency, type and severity of crashes occurring on the facility. The historical and long-term objective safety of a location based on crash data is known as substantive safety. A particular intersection that has experienced fewer than expected crashes over an extended period will be referred to as a substantively safe location, while a corridor with a higher than expected number of crashes is substantively unsafe. Unlike nominal safety, substantive safety operates on a continuum and allows for a range of explanations as to why a particular safety problem exists.
Another key distinction is the fact that a location can be nominally safe—adhering to all standards and design criteria—while experiencing high rates of crashes, making it substantively unsafe. Similarly, a substantively safe location (one that has a lower than expected crash rate) may be nominally unsafe if it does not meet the applicable design standards.
Agencies and safety professionals should strive to prioritize the substantive safety of a facility. Simply building a road that meets all the current design standards will not ensure that the road is substantively safe. Using professional judgement to prioritize safety improvements and select appropriate designs within a range of options, based on observations of road user behavior and other available data, will increase the chance that all factors are considered. The end result will be a road that moves a step closer to the ultimate goal of having a transportation system free of injuries and deaths.
The goal of improving safety exists alongside other goals of the transportation system, such as mobility, efficient movement of people and goods, environmental concerns, public health, and economic goals. In this way, transportation professionals and policy makers often refer to trade-offs—making a decision to favor one goal at the expense of another. While those in the field of road safety continually look for new designs and technologies to advance all goals, there continue to be many instances where public agencies must weigh competing goals for a location or portion of the road network and decide what trade-offs should be made for the goal of increasing road safety.
Below are several examples:
Sometimes improving safety for one group of road users may negatively impact the safety of another group. It can also be the case that improving mobility for a group of road users may negatively affect the safety of that same group. There is no absolutely correct answer to many of these trade-offs, as they are all context-specific. Transportation professionals need to discuss the various trade-offs in the context of a particular community’s transportation goals. These types of trade-offs are made every day, and require the cooperation of numerous agencies and stakeholders, all of whom have a role to play in transportation decision making. Despite the temptation to study road safety as a self-contained system, there are a multitude of factors influencing and being influenced by road safety and travel behavior. In order to make informed decisions about the transportation system, transportation professionals must understand the impacts—both positive and negative—that design, operations, and policy decisions have on the safety of the transportation network as well as the impacts on other areas such as public health, mobility, environmental quality, and economic growth.
When examining current efforts to address road safety, it is useful to view them in the context of American transportation history. Recent decades have witnessed numerous advances in the field of road safety. This growing national consciousness about the need for safer roads provides a stark contrast to the first half of the twentieth century when the focus was on highway expansion. The following chapter will provide an overview of the major milestones and achievements that led to the transportation system we have today, as well as the policies and practices that were implemented to address a growing safety problem.
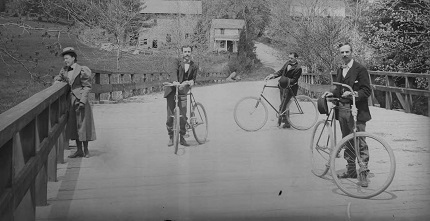
Three men with bicycles on bridge near Pierce Mill, Washington, D.C., 1885.
(Source: Brady-Handy Collection, U.S. Library of Congress)
As in modern times, in the early days of the automobile, posted speed limits were set far below the speed of which most motor vehicles were capable.
With faster and heavier traffic, it became dangerous to drive in the middle of the road and the States began painting centerlines on the pavements to channel traffic in lanes. At 40 miles per hour, these lanes appeared uncomfortably narrow to most motorists, especially when passing trucks. The lane lines also caused trucks to run closer to the shoulder, causing the slab edges and corners of the road to break. To provide greater safety and reduce edge damage, State highway departments built wider pavements and made new roads straighter.
These improvements along with mechanical advances in vehicles, such as more powerful engines and four-wheel brakes, in turn encouraged even faster speeds.
Thus, after 1918, highway design followed a spiral of cause and effect, resulting in faster and faster speeds and wider and wider pavements. The motivating force behind this spiral was the driving speed preferences of the great mass of vehicle operators. The public authorities were never able to impose or enforce speed limits for very long if the majority of drivers considered the limits unreasonably low. Now, many current engineering practices use the 85th percentile speed—or the speed at which the majority of drivers travel—as the method of setting speed limits.
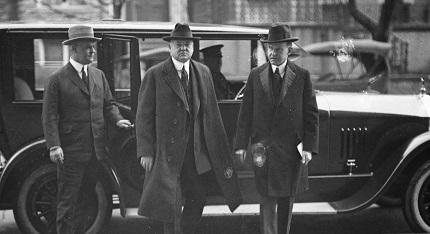
Secretary of Commerce Herbert Hoover, center, with President Calvin Coolidge, right, in February 1924.
(Source: Harris & Ewing Collection, U.S. Library of Congress)
In the 1920s and 1930s, it was good engineering practice to design new highways as much as possible in long straight lines or “tangents.” When it became necessary to change direction, the engineer laid out a circular curve, the radius of which he selected to fit the ground with the least construction cost, but which could not be less than a certain minimum fixed by department policy. In practice, engineers made the curves sharper than this minimum when it was cheaper to do so, but with little consistency. Engineers expected motorists driving these roads to adjust their speeds to the varying radii, and on the sharper curves safe design speed might be considerably lower than the posted speed limit.
Increasing concern for road safety led many highway engineers to worry about this inconsistency between posted speed limits and safe design speed on curves. In 1935, highway engineer Joseph Barnett of the BPR proposed that all new rural roads conform to an “assumed design speed,” a comfortable top speed for drivers outside of urban areas.
With its adoption by American Association of State Highway Officials in 1938, Barnett’s “balanced design” concept became a permanent feature of U.S. roadway design. Today, standards for designing curves, such as design speed, curve radius and superelevation (the tilt of the road through a curve) are provided in A Policy on Geometric Design of Highways and Streets, produced by the American Association for State Highway Transportation Officials.
Before World War I, most States were using signs to warn road users of danger ahead, particularly at railroad crossings; railroad companies themselves were required to post warning signs at all public road crossings. However, there was little agreement between States about the specific design of these warning devices, and the signs were a variety of shapes, sizes, and colors.
In 1929, the American Engineering Council surveyed sign practices in all U.S. cities with a population of more than 50,000 and created a document that was, in effect, a manual of the best practices of the time. Recognizing the need for standard practices for signs in rural and urban areas, the American Association of State Highway Officials and the National Conference on Street and Highway Safety organized a Joint Committee on Uniform Traffic Control Devices in 1931 and introduced a new manual for national use in 1935. The manual of best practices changed over time to become the Manual on Uniform Traffic Control Devices.
An exploration of the history of road safety in the U.S. can begin at many different points—some of our roads were developed as precolonial routes and others were trails blazed by Native Americans. In terms of lasting influence on the modern transportation network, however, it is most useful to begin the discussion in the late nineteenth century.
In the 1880s and 1890s, bicycles were the dominant vehicle on our nation’s roads. With the introduction of the “safety” bicycle, with two wheels of the same size, and the pneumatic tire in the late 1880s, the bicycling craze became an economic, political, and social force in the U.S. By 1890, the U.S. was manufacturing more than 1 million bicycles each year.
At that time, bicyclist behavior—particularly careless or risk-taking behavior—was a contributing factor to bicycle crashes. However, the biggest contributor to crashes existed outside the cities; the poor condition of the nation’s roads made cycling a laborious and dangerous process. Bicycle groups worked at the Federal, State, and local levels to secure road improvement legislation. The work of these advocacy groups became known as the Good Roads Movement.
To build support, advocates tailored their message to farmers with the argument that bad roads, by increasing transportation expenditures, cost more than good roads. While engineers, writers, and politicians joined the movement, bicyclists dominated the Good Roads Movement until cars arrived in the early twentieth century.5
By the close of century, automobiles had slowly begun to share the road with bicyclists and pedestrians, benefitting from many of the road improvement efforts spearheaded by cycling groups. In 1899, a motor vehicle struck and killed a New York City pedestrian. This event marked the first time in the U.S. that a person was killed in a crash involving a motor vehicle.6
In 1905, only 78,000 automobiles, most of which were confined to the cities, traveled the U.S. Ten years later, 2.33 million automobiles were traveling the country’s roads, and by 1918, this number had increased to 5.55 million. Mass production made this increase possible as it lowered vehicle manufacturing costs, putting vehicles within the reach of the middle class. As more vehicles became available at a lower price, the pattern of daily travel in the U.S. began to shift. Longer vehicle trips replaced shorter trips by foot or bicycle, and development patterns began to follow suit. The motor age had arrived, and with it a new kind of highway would evolve, designed specifically for motor vehicles.
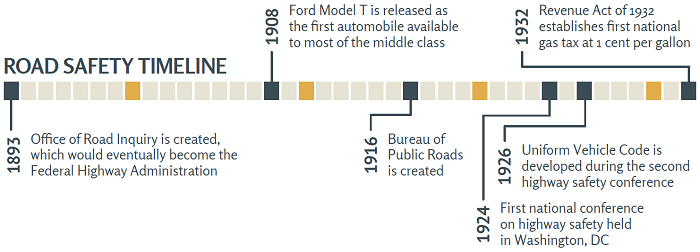
Expansion of automobile use had immediate positive effects on the national economy and quality of life around the country. Yet proliferation of motor vehicles also had a negative side. As millions of new drivers took to the roads, traffic crashes increased rapidly—tripling from 10,723 in 1918 to 31,215 in 1929.7
Recognizing the rise in crashes and resulting injuries and fatalities, Secretary of Commerce Herbert Hoover convened the First National Conference on Street and Highway Safety in Washington, D.C., in December 1924. Here, for the first time, representatives of State highway and motor vehicle commissions, law enforcement, insurance companies, automobile associations and a multitude of other stakeholders and interest groups met in one place to discuss how to address the growing number of fatalities and serious injuries.
Prior to the conference, committees were established to perform research into areas such as planning and zoning, traffic control, motor vehicles, statistics, and other areas related to road safety. These committees reported wide differences in traffic regulations from State to State and city to city. For instance, twenty States did not attempt to collect crash statistics, only eight States required reporting crashes that resulted in personal injury, and 38 required railroads and common carriers to report highway crashes. Other committees devoted their attention to issues like traffic control and vehicle speeds, infrastructure and maintenance concerns, and issues impacting vehicles and their drivers.
Conference participants supported a wide range of measures to reduce the rate of crashes and recommended that legislative, administrative, technical, and educational bodies adopt them. Conference participants also recommended that the States take the lead by passing adequate motor vehicle laws and setting up suitable agencies for administering the laws, policing the highways, registering vehicles, and licensing drivers.
To the Federal Government, the conference assigned the role of encouragement, assembly and distribution of information, and the development of recommended practices. Adoption and implementation of these recommended practices would be left to the individual States.
Secretary Hoover called a second conference for March 1926. During the interim between the two conferences, a special committee drew up a model “Uniform Vehicle Code” covering registration and titling of vehicles, licensing of drivers, and operation of vehicles on the highways. The code incorporated the best features of the numerous and varied State laws then on the statute books. The second conference approved this code and recommended it to the State legislatures as the basis for uniform motor vehicle legislation.
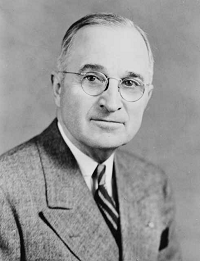
President Harry S. Truman, 1945.
(Source: U.S. Library of Congress)
Studies following this 1926 conference concluded that determining the causes of crashes was far more difficult than they had presumed. The problem warranted a sustained program of research by a national organization. The Conference agreed, and the Highway Research Board (HRB) organized the Committee on Causes and Prevention of Highway Accidents to coordinate crash research nationwide. The HRB played a major part in subsequent efforts to reduce the consequences of crashes.8
The growing use of motor vehicles during the 1920s was mirrored by the expansion of the Federal Government’s role in funding and building roads. In its early form, the Office of Public Roads was organized under the U.S. Department of Agriculture, playing a large role in funding roadways within national parks and forests.
Following the Federal Aid Road Act of 1916, this office would become the Bureau of Public Roads (BPR), charged with working cooperatively with State highway departments on road projects. Work continued on the expansion of highways across the country, and between 1921 and 1939, the distance of paved roads increased from 387,000 miles to nearly 1.4 million miles.9 The BPR recognized that the antiquated highway system was one of the contributing causes of the high crash toll, but did not go so far as to identify primary crash causes or recommend potential solutions.
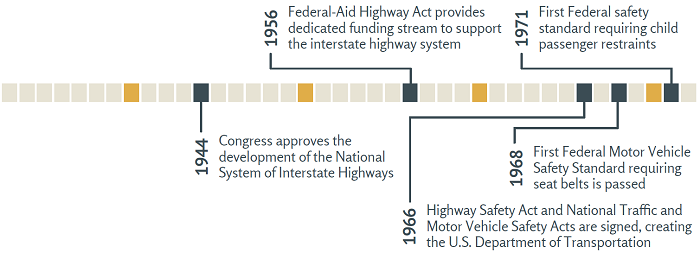
During this time, an emphasis was placed on expanding the Federal role in the process of highway design and development. This effort culminated in 1944 when Congress approved the development of a National System of Interstate Highways along with that year’s Federal Aid Highway Act. Though expansive in scope, calling for a 40,000 mile network, the legislation was not accompanied by any funds to support the development of these highways. Without funding, the legislation did not significantly expand the highway system.
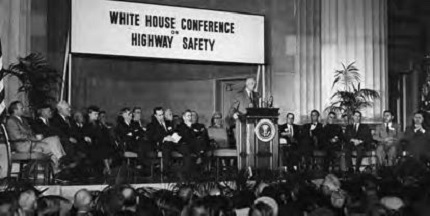
President Dwight D. Eisenhower speaks to the White House Conference on Highway Safety, 1954.
(Source: Eisenhower Presidential Library)
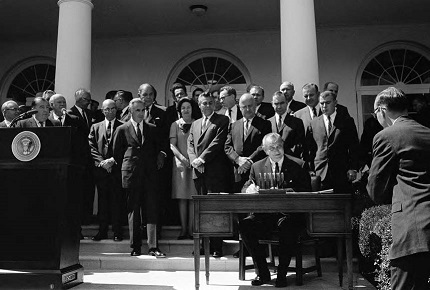
President Lyndon B. Johnson signs the National Traffic and Motor Vehicle Safety Act of 1966 and the Highway Safety Act of 1966.
(Source: LBJ Presidential Library)
Road safety continued to present a national concern. In May 1946, President Harry S. Truman spoke at the Highway Safety Conference to rally public support to improve State motor vehicle laws, driver licensing, and education. After summarizing his unsuccessful efforts as a U.S. senator to enact Federal legislation on motor vehicle registration and driver licensing, the President said Congress was not yet ready to interfere with what many perceived as State prerogatives. However, he noted that the Federal Government would not stand aside if the rates of highway fatalities continued to rise.10
Economic conditions following World War II led to even higher levels of driving and automobile ownership. Personal savings of almost $44 billion created a market for housing and other types of goods, chief among them new automobiles. Automobile production jumped from a nearly 70,000 in 1945 to 3.9 million in 1948.
Because of this increase in vehicle production, motor vehicle registrations spiked and the number of drivers on the nation’s roads and highways reached unprecedented levels. Under wartime rationing of rubber, and specifically tires, States had implemented speed controls to reduce wear and tear and improve tire longevity. With the end of rationing and emergency speed controls at the conclusion of the war, highway travel returned to pre-war levels and began a steady climb of about 6 percent per year, which would continue for nearly three decades.
While the increasing popularity of low density housing development (i.e., the suburbs) and the availability of motor vehicles created perfect conditions for more driving, the nation’s roads and highways were unprepared for the increase in traffic. Under wartime restrictions, States were unable to adequately maintain their highways. With widespread operation of overloaded trucks and reduced maintenance, the State highway systems were in worse structural shape post-war than before the war.
Though the National System of Interstate Highways had been established by legislation in 1944, little progress was made over the next decade. Without funding, established routes were slow to develop. That changed in 1956, when President Dwight D. Eisenhower signed the Federal-Aid Highway Act of 1956. This legislation linked the development of the interstate highway system to the interest of national defense and assigned funding that would rapidly expand the highway network.11 The act established a dedicated funding stream and a plan for highway development that launched the nation into an unprecedented era of expansion in which new interstate corridors linked cities and towns to one another.
Despite the enthusiasm of political and business leaders, the growth of this system was not without its critics. These critics primarily denounced the destruction of homes and separation of communities that sometimes resulted from new highways bisecting established neighborhoods. Though this opposition halted projects in some locations, it did not stop the expansion of the interstate highway system.
In 1964, the U.S. faced a sharp rise in the number of traffic fatalities. An increased number of vehicles on the roadways combined with a public culture that did not prioritize roadway safety consciousness led to 47,700 deaths on the nation’s highways, an increase of 10 percent over the number of fatalities that occurred in 1963. These deaths prompted the nation to take a hard look at road safety efforts and resulted in Congressional hearings in March 1965 to raise public awareness of the growing national crisis.12
To respond to these trends, the nation needed a change of direction in the design and operation of its roads and vehicles. This change began with reviewing safety standards in these areas and conducting research to identify effective measures to improve safety. The 1960s was a pivotal decade for road safety due to the passage of laws that provided funding and new policies. On September 9, 1966, President Lyndon B. Johnson signed the National Traffic and Motor Vehicle Safety Act of 1966 and the Highway Safety Act of 1966. The signing ceremony in the Rose Garden of the White House marked a transformation in the role of the Federal Government in road safety. This role had been growing during the Eisenhower administration, but became a larger area of emphasis as fatalities on the nation’s highways climbed toward 50,000. Those in the federal government observed that the steps taken during the previous two decades to reverse the climbing number of fatalities had failed, and they believed that road safety should no longer be left solely to the responsibility of the States, the automobile industry, and the individual drivers.13
This legislation established the U.S. Department of Transportation (USDOT) and transformed the Bureau of Public Roads into the Federal Highway Administration (FHWA). New bureaus were added to address safety in areas of growing concern, such as the Bureau of Motor Carrier Safety and National Highway Safety Bureau (these would later become the Federal Motor Carrier Safety Administration and the National Highway Traffic Safety Administration, respectively). The USDOT proceeded to develop programs and initiatives and pave the way for activities still in place today.14
Advances in vehicle design and policy were also an area of emphasis during the 1960s. In 1968, federal legislation required vehicles to provide seat belts.15 Federal law also required States to begin implementing motorcycle helmet laws in order to qualify for particular sources of funding.16 These requirements led to more widespread implementation of safety policies through the late 1960s and 1970s. Section 402 of the Highway Safety Act established a revenue stream for funding to directly support State programs aimed at improving road safety. Known as the State and Community Highway Safety Grant Program, the funds originally supported a variety of program areas, including many many behavioral safety programs that are still in existence today. 17
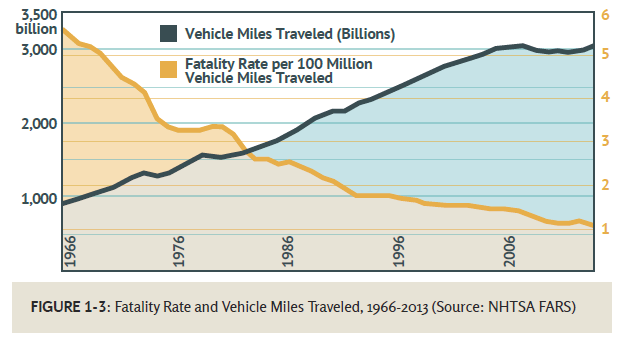
The 1970s and 1980s were characterized by energy crises in 1973 and 1979 that had immediate and lasting impacts on travel trends. Vehicle Miles Traveled (VMT) decreased following each of these events, as Americans drove less due to rising fuel costs. Strategic legislative action by Congress, such as the National Maximum Speed Law of 1974 which prohibited speeds higher than 55 miles per hour also helped by decreasing fuel costs. The law would later be repealed in 1995, allowing States to set their own maximum speed limits.
Between 1970 and 2007, there were two periods of time when VMT decreased from the previous year. These years include 1974 and 1979, each of which saw a roughly 18 billion mile decrease in VMT from the previous year.18 As driving decreased, so did traffic fatalities. From 1973 to 1974, for example, traffic fatalities went down 16 percent – the largest single year decline since 1941-1942.19 Driving levels began to increase again once fuel costs normalized, so the reductions were not sustained beyond the period of economic stagnation.
The Highway Safety Act of 1973 established a specific methodology for improving roadway safety from an engineering perspective. It required the States to first survey all hazardous locations and examine the causes of crashes at these sites. A benefit/cost analysis was then performed to prioritize needed improvements. This process set the stage for the current safety management processes and would be refined and improved over the years.
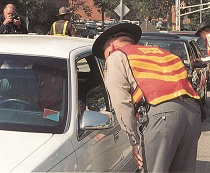
Officers use specialized devices to measure drivers’ blood alcohol content.
The Highway Safety Act of 1973 also clarified the relationship between the Federal Government and the States. The Federal Government was to direct policy and program components, while the States were responsible for implementing those policies and programs.20
During the 1970s, Congress also established the Motor Carrier Safety Assistance Program (MCSAP). This program provides financial assistance to States to reduce the number and severity of crashes and hazardous materials incidents involving commercial motor vehicles (CMV) through inspection and enforcement programs focused on trucks, carriers, and driver regulations.21
Vehicle safety continued to be a priority in the 1970s and 1980s, as more States began to implement laws requiring the use of seat belts and motorcycle helmets. New York became the first State to adopt a mandatory seat belt law in 1984, and other States soon followed suit.22 The Federal Motor Vehicle Safety Standard 213 brought attention to child passenger safety. This standard was the first to outline specific requirements for restraint systems designed for children.
The 1990s saw a shift from transportation policies that focused on motor vehicle safety and efficiency to an acknowledgement of alternate modes of transportation, such as bicycling, walking and use of public transit. The Intermodal Surface Transportation Efficiency Act of 1991 (ISTEA) added a multimodal perspective to the Federal-aid highway program.
While ISTEA was not specifically focused on transportation safety, it created some programs to promote safer travel. For example, ISTEA enhanced road safety with new programs that encouraged the use of safety belts and motorcycle helmets.23 The legislation also required the installation of airbags for drivers and front passengers in all cars and trucks.24
In 1998, the Transportation Equity Act for the 21st Century (TEA-21) provided more focus for roadway safety planning by establishing safety and security as planning priorities. Prior to TEA-21, a State or Metropolitan Planning Organization (MPO) may have incorporated safety in its goals or long-range transportation plan, but specific strategies to increase safety were seldom included in statewide and metropolitan planning processes or documents.
TEA-21 established the Highway Safety Infrastructure program (not to be confused with the Highway Safety Improvement Program, which would be developed several years later), which funded safety improvement projects to eliminate safety problems.
The TEA-21 legislation also encouraged States to adopt and implement effective programs to improve the quality (e.g. timeliness, accuracy, completeness, uniformity and accessibility) of State data needed to identify safety priorities for national, State and local road safety programs.25
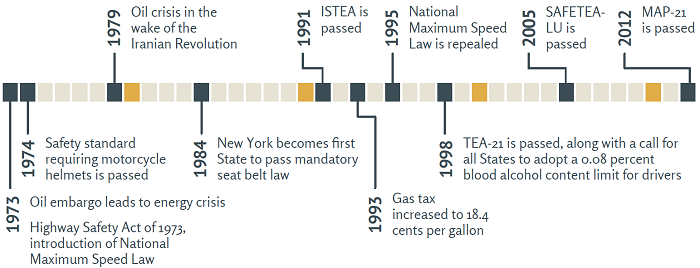
Not to be lost among the TEA-21 legislation, another pivotal moment in transportation legislation came in 2000 when an important provision related to alcohol was included in the USDOT appropriation act. The appropriation carried a requirement that all States must enact laws to limit the legal blood alcohol content (BAC) of drivers to 0.08 percent.26 This limit was in line with similar limits imposed on drivers in other countries, though some European countries limit the legal BAC to 0.05 percent.
While 19 States and Washington, D.C., had already enacted this law, the Federal mandate provided a further incentive for other States to do so: States that did not pass the law by 2004 would forego a portion of their transportation funding. Though specific laws vary, each State now recognizes the legal limit of 0.08 percent blood alcohol content.27
Twenty-first century legislation continued to move Federal transportation funding and policy in the direction of focusing on multimodal, data-driven approaches to improving the transportation system. One specific area of focus was a move toward safety planning. Transportation safety planning shifts the focus of traditional planning efforts to a more comprehensive process that integrates safety into transportation decision-making. Safety planning encompasses corridors and entire transportation networks at the local, regional, and State levels, as well as specific sites.28
In 2005, Congress passed the Safe, Accountable, Flexible, and Efficient Transportation Equity Act-A Legacy for Users (SAFETEA-LU). SAFETEA-LU raised the stature of Federal road safety programs by establishing the Highway Safety Improvement Program (HSIP) as a core Federal-aid program tied to strategic safety planning and performance. HSIP is one of six core Federal-aid programs under which funds are apportioned directly to the States. One of the major elements of the HSIP was the requirement for each State to develop and implement a Strategic Highway Safety Plan (SHSP).29 The plans sought to establish data-driven approaches that were coordinated with a broad range of stakeholders and utilized a diverse set of disciplines (e.g., engineering, enforcement, education and emergency response). These data-driven plans had to include clear methods for measuring progress toward safety goals.
The Moving Ahead for Progress in the 21st Century Act (MAP-21) was signed into law in 2012. The 2012 legislation transformed the policy and programmatic framework for investments in the country’s transportation infrastructure, enhancing the programs and policies established in 1991.
MAP-21 doubled funding for road safety improvement projects, strengthened the linkage among modal safety programs and created a positive agenda to make significant progress in reducing highway fatalities and serious injuries. It provided increased focus on the importance of high quality data, transportation infrastructure and the safety of local streets.
Exploring the history of travel trends and safety in the U.S. helps illustrate how past decisions have led to the transportation system seen today. Safety has not always been a deciding factor in how roads are built. However, today, safety is a top priority of the USDOT.30 Most State and local transportation agencies share USDOT’s goal; some have even set goals to reduce total traffic fatalities to zero. These “vision zero” and “toward zero deaths” goals are guiding transportation projects by requiring safety to be incorporated into every step of project planning, design, construction and operation.
Future safety issues will certainly arise as technological advancements lead to changes in the vehicle fleet. Autonomous and potentially driverless vehicles are being developed and tested across the world. Though safety improvements are touted as a benefit of these advanced vehicles, safety will continue to be a priority as they begin to share the roads with older vehicles, bicyclists, and pedestrians. As can be learned from the history of road safety in the U.S., complex problems must be met with safety advancements, legislative action, and collaboration.
Road safety is a complex issue, and any efforts to improve safety must address not only the roadway but also road user behavior, vehicle design, interaction between road users, and the effect of the roadway on all road users. Road safety partners include anyone who influences road user safety, including those in infrastructure safety, behavioral roadway safety, transportation planning, public health, public safety and many other disciplines. Each of these disciplines is able to provide a unique perspective and each has specific methods for addressing road safety. It is becoming increasingly common for these various disciplines to work in collaboration with one another to address road safety through comprehensive programs. Instead of focusing on traditional “silos” of activity, agencies hope that this interaction and collaboration among various disciplines will lead to continued safety improvements.
A popular multidisciplinary approach to road safety is sometimes referred to as the “four E’s;” Engineering, Education, Enforcement, and Emergency response. These E’s broadly represent the various disciplines that bring together stakeholders who care about making the road safe for all users. Sometimes a fifth “E” for evaluation is added to this list to represent the important role of evaluating what works and what doesn’t. This emphasizes the fact that good data is crucial to the improvement of road safety.
This chapter will discuss road safety efforts from the disciplines of roadway design and engineering, public education, and enforcement campaigns. Working in collaboration with one another, as described above, these groups can share the burden of road safety responsibilities and create comprehensive programs to address the various factors that may contribute to crashes.
Several types of transportation professionals are responsible for roadway safety engineering. Broadly speaking, the roadway safety engineering community includes transportation planners and engineers.
Transportation planning plays a critical role in determining the shape of the transportation system and provides an early opportunity for professionals to address safety needs. Before a road project is designed or built, it is influenced by any number of comprehensive and strategic transportation plans that are coordinated to ensure that the system being developed is one that matches the vision of the local community. Planners work with stakeholders such as the general public, business owners, policy makers, and advocates to establish plans for how the transportation system can best serve every group’s needs.
In the past, the traditional planning process focused on economic development, environmental quality, and mobility as the three primary concerns. Most States consider infrastructure safety improvements as part of preservation or improvements projects or within operational changes undertaken by traffic offices. States are now able to use the Highway Safety Improvement Program (HSIP) to fund safety projects in at high priority locations. This program allows development of targeted solutions and approaches that address the contributing factors to collisions, thereby seeking to achieve a higher return on safety investments.
Roadway engineers work on the design, construction and system preservation of the roadways. In particular, engineers are charged with designing roads that minimize the chance that crashes will occur while balancing the needs for efficiency and mobility. Engineers also work to design roads and intersection in such a way that minimizes crash severity and injury risk when crashes do occur. Engineers affect the safety of the built environment by incorporating safety in to the planning process at the beginning of a project; selecting design alternatives that prioritize safety considerations; using design elements that maximize the safety of each part of the road or intersection; ensuring quality and safe construction, operation, and maintenance of the roads; and addressing safety problems at existing locations.
Countermeasures That Work31 is a comprehensive guidance document providing details of different programs and interventions that are effective in improving safety. The guide is published regularly by NHTSA.
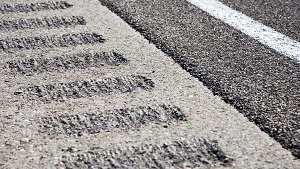
Infrastructure improvements such as paved shoulders, rumble strips, and improved nighttime visibility may prevent drivers from veering off the roadway, and still other opportunities exist for improving the roadside and road user behavior. For example, when a driver veers off the roadway, it is important to provide a roadside environment that reduces the potential for crashes and injury. Roadside slopes and objects such as drainage structures, trees, and utility poles are examples of roadside elements that engineers can target for improvements to road safety performance. One engineering method to increase roadside safety is to create a clear zone—an unobstructed, traversable roadside area that allows a driver to stop safely or regain control of the vehicle that has left the roadway.
Engineering solutions must incorporate the different needs and preferences of a variety of user groups. As mentioned previously, this often means that tough decisions and trade-offs must be made to arrive at infrastructure solutions that balance the needs of different users. This trade-off can be illustrated with an example of a signalized intersection. Improving intersection safety for pedestrians may involve adding pedestrian crossing time to the signal or separating turn movements to eliminate high risk conflicts. Protected left-turn phases can also improve safety for vehicles, as shown previously. But these new or longer signal phases either add time to the cycle length or keep the same length while reducing time for the through movements. Regardless, the result is more delay to both pedestrians and motorists. In such situations, it is necessary to consider all of these needs and select the appropriate signal timing that meets the needs of all users. Adhering to design standards—creating nominally safe—is only one aspect of the complex roadway design and engineering field. Addressing substantive safety through design strategies requires an understanding of multiple perspectives, trade-offs and user needs.
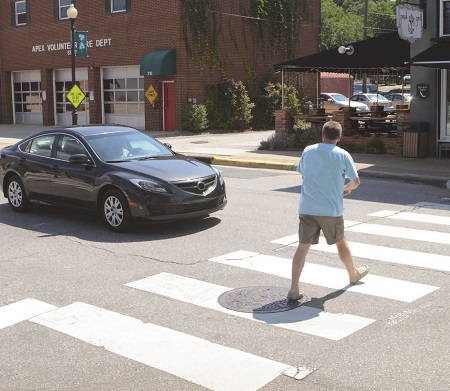
To reinforce pedestrian safety laws, police departments can initiate targeted enforcement operations at crosswalks. Under this approach, a law enforcement officer in plain clothes will attempt to cross the street at an uncontrolled crosswalk. Drivers who do not yield to the officer will be pulled over and either cited or warned by patrol vehicles waiting beyond the crosswalk. More info: https://www.nhtsa.gov/staticfiles/nti/pdf/812059-PedestrianSafetyEnforceOperaHowToGuide.pdf
Public education and communications campaigns are commonly used to improve road user attitudes and awareness. The structure and delivery methods of these campaigns can take many forms. However, they generally involve materials (media advertisements, informational brochures, posters, presentations, etc.) to inform people of a desired behavior and the benefits of such behavior (or conversely, the risks of an unwanted behavior).
While standalone informational or educational campaigns can improve awareness or perceptions about road safety issues, they are unlikely to change road user behavior. Rather, campaigns that educate the public about increased law enforcement efforts aimed at a particular behavior have been shown to be effective. Generally referred to as “high-visibility enforcement” these campaigns increase the perceived enforcement of a particular law. When people believe there is a high probability of being caught, they are more likely to follow the law. The Click it or Ticket campaign is one of the most widely known examples of high-visibility enforcement. In this case, simply enforcing the seatbelt law was not sufficient. The key to this program’s success was the media coverage and other informational campaigns telling the public that law enforcement officers are looking for people who are not wearing a seatbelt. In other words, for those people who do not typically wear a seatbelt, the law itself was not sufficient motivation to change. The motivation came from a perceived threat of being caught and ticketed.
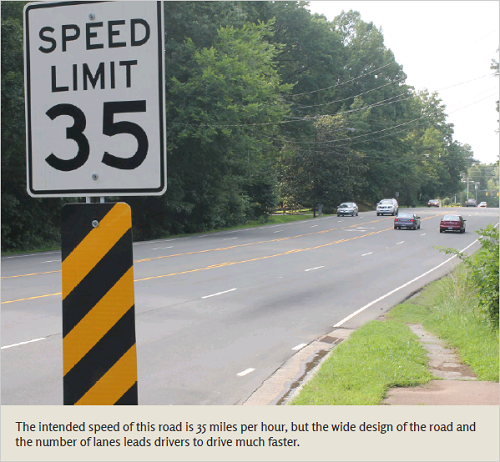
When safety professionals analyze possible educational campaigns, they must consider the factors that affect people’s behavior and the probability that the campaign will change such behavior. Simply communicating safety messages and enforcing laws may not lead to a change in behavior if a road is designed in a way that allows (or unintentionally encourages) unsafe behaviors. For example, to address a speeding problem on a wide multilane arterial where the posted speed is 35 miles per hour, enforcement and education may not be the only solution. Narrowing the roadway and creating more “visual friction” along the roadside may be needed to alter the desired design speed of the road. Supplemental education and enforcement campaigns can then help reinforce the proper behavior. This emphasizes the need for cooperation and coordination between disciplines to accomplish meaningful improvements to road safety.

Bicycle Safer Journey is an educational program intended to provide bicycle safety skills and education to children. The program uses interactive video lessons to teach children safe bicycling skills and provides resources for parents and teachers. The program can be accessed online at http://www.pedbikeinfo.org/bicyclesaferjourney.
While there is evidence to suggest some success for well-designed and executed safety education campaigns when they are targeted at children,32 the same results have not been shown for teens and adults when an educational campaign stands alone. Though well-intentioned, these approaches generally assume that people are not performing the desired behavior simply because they lack the appropriate information. However, this idea fails to take into account the fact that, in general, most human behavior is not the result of conscious, rational deliberation. People are largely influenced by emotions, values, social context, and culture, among many other factors. Thus, simply being presented with information or facts alone is unlikely to lead to any lasting behavior change. In the context of transportation safety, most people do not engage in risky or undesirable behaviors due to a lack of knowledge about the desired behavior. Instead, people act based on a variety of contributing factors.
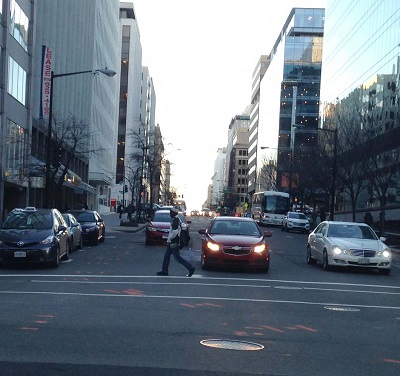
For example, consider the behavior of a pedestrian on a multi-lane undivided arterial. The goal of the pedestrian is to get to a bus stop located directly across the street from his current location. The pedestrian almost certainly knows that the desired behavior is to walk a quarter mile to the signalized intersection, wait and cross with the crossing signal, and then to backtrack a quarter mile to the bus station. However, instead the pedestrian chooses to cross in the middle of the block. The fact is that there are many factors that influence the pedestrian’s decision to cross mid-block (time, ability, weather, etc.), but likely the most important factor is that doing so just makes sense. People are wired to choose the option that makes the most intuitive sense. Efforts to change this behavior only through signs, posters or other educational campaigns will likely have only minimal effect.
Similar examples can be found throughout the transportation safety field. Most people already know they should wear their seatbelt, obey posted speed limit signs, and limit distractions while driving. Yet some people refuse to wear a seatbelt, some people speed, and some people text while driving. Knowledge alone is not enough.
Click It or Ticket is a successful seat belt enforcement campaign that has helped to increase the national seat belt usage rate. The program uses public education to communicate the law and risks of not using seat belts in a variety of settings. The campaigns provide waves of education and enforcement along with high visibility media coverage to publicize and sustain the campaign. NHTSA manages this campaign annually with assistance from the State Highway Safety offices, law enforcement agencies, and national- and local-paid advertising.
Well planned and executed media campaigns centered on reducing alcohol-impaired driving can be effective in reducing the occurrence of alcohol related crashes. A study in 2004 pointed to a 13 percent decrease in alcohol related crashes following these types of campaigns.33
Successful education and enforcement campaigns recognize the reality of people’s behaviors and apply this knowledge to the safety efforts. For example, social norms and cultural influences can provide some explanation for why certain behaviors are common—even those behaviors known to be unsafe. Marketing interventions based on social norms have been applied to the areas of distracted driving and driving under the influence of alcohol. Such methods provide a way to examine safety problems and what might be done to address them through education and enforcement.

While each discipline has its own strengths, significant improvements in roadway safety are more likely when a program encompasses many disciplines rather than just one. Interdisciplinary team efforts can take on safety problems using multiple approaches and are therefore greater in scope than individual disciplines working in isolation. The need for this “multiple approach” solution requires collaboration among many parties. This type of collaboration is most clearly seen when agencies seek to create a comprehensive safety plan. Creating a comprehensive safety plan for a city, county, or state must be a data driven process. In doing so, agencies first begin by analyzing their safety data to identify emphasis areas where concentrated efforts are likely to yield the largest reduction in fatalities and serious injuries.
A State’s Strategic Highway Safety Plan (SHSP) is an example of a comprehensive safety plan, and one of the best examples of a multidisciplinary, data driven planning effort. A State SHSP provides a framework for developing a coordinated and comprehensive approach to addressing road safety across a State. In the development of a State’s SHSP, safety stakeholders from across the State and across disciplines will consider all the data available (i.e., crash, injury surveillance, roadway and traffic, vehicle, enforcement, and driver data) that will help an agency understand where more safety emphasis is needed.34 Beyond crash records, an agency may choose to rely on alternate data sources like roadway characteristics and its own knowledge of crash risk to pursue systemic safety strategies. A systemic approach proactively identifies locations that may have a high risk of crashes but where the risk has not yet resulted in actual crashes.35 Demographic data showing where population growth has occurred, or where it is expected, can also influence an agency’s safety plans. One of the most critical components of the SHSP is an evaluation of past efforts, so that the agency can know what strategies are working and so that progress toward goals can be measured and tracked over time.
Road safety planning, like the field of safety itself, is multidisciplinary in nature and relies upon the expertise and involvement of numerous perspectives. Once developed, these safety plans influence activities ranging from roadway design and engineering to law enforcement and safety education.
Each of the agencies and organizations involved in transportation safety brings a unique and valuable perspective to bear on the roadway safety problem. Their competing philosophies, worldviews and problem solving approaches, however, can make collaboration difficult. Creating a foundation for effective collaboration and establishing a process to support collaborative efforts are two ways to overcome these barriers. One way to create a foundation for collaboration is to ensure that each agency understands the impact that its actions have on road safety and that each makes safety its top priority. The example of a State Strategic Highway Safety Plan shows this type of collaboration. The SHSP process brings together all potential areas of safety emphasis, including intersections, non-motorized users, rural crashes, and others, and uses a data driven approach to identify priorities and areas of need. This foundation can be further strengthened by identifying which agencies or organizations are responsible for implementing each of the strategies identified in the SHSP.
In the U.S., no single player manages all programs and disciplines that impact road safety. Therefore, collaboration among all players is fundamental to consistently reduce serious injuries and fatalities.
Provides a framework for developing a coordinated and comprehensive approach to addressing road safety across a State.
Drivers of motor vehicles are far from the only users of the road, despite accounting for the majority of trips taken in the U.S. The public right-of-way on most roads is usually shared by a number of different users, traveling by a variety of modes for any number of different reasons. Transportation professionals must understand the mobility and safety needs of different user groups and how they interact with one another to gain a better understanding of safety problems and their potential solutions.
Road user groups include:
Passenger vehicles are typically defined as sedans, pickup trucks, minivans, and sport utility vehicles and represent the primary mode of transportation for the majority of Americans. Since these vehicles account for the vast majority of registered vehicles and vehicle miles traveled, it is not surprising that much of the transportation infrastructure prioritizes the needs of these drivers.
However, despite the priority given to drivers of passenger vehicle, there remain many unresolved safety issues for these drivers. At the core of most of these issues are the driver’s actions while navigating the road network. Engineers may work to make a road nominally safe by ensuring it follows the latest recommendations and design standards. However, drivers do not always interact with the road system as road designers expect them to. Thus, a nominally safe road may be much less safe in a substantive sense. While the common reaction has been to assume that some fault or “driver error” led to the crash, this approach fails to take into account a common behavioral principle known as behavioral adaptation. Simply put, behavioral adaptation refers to the unconscious process by which people react to their environment—people cannot be considered to be a constant in the system.
Consider a town that wants to resurface and widen a two-lane collector roadway through an older neighborhood with mature street trees. The existing road has 9.5 foot wide lanes, a 30 mi/h (48 ki/h) speed limit, and street trees between the roadway and sidewalk. Design guidance may suggest a typical lane width of 12 feet and a wider roadside clear zone. It is easy to assume that the safest choice would be to design a road with the widest lanes possible and removal of the roadside hazards. However, after this resurfacing and widening project was completed, both traffic speeds and crash severity along this roadway may increase considerably. On the surface, this may seem counterintuitive.
In essence, most people drive at a speed that feels safe to them. To reach this “safe speed,” people unconsciously assess the roadway and its characteristics. Navigating a narrow, curvy road with significant roadside hazards is more challenging than navigating a straight, wide road with large clear zones, so people unconsciously drive slower and more cautiously on the narrow road. When the driving task is made easier by widening the lanes and removing roadside hazards, people will not maintain their original behavior. In fact, the assumption should be that people will adapt to this change and unconsciously change their behavior accordingly, in this case by increasing their speed.
Behavioral adaptation is not specific to passenger vehicles. When designing the transportation infrastructure, engineers must consider how human behavior plays affects all roadway users. Roadway designers must design roads not for the way in which they would like users to behave, but for the way in which users actually behave. Behavior of drivers and other road users will be covered in a greater detail in Unit 2.
Much of the transportation network across the country serves an important commercial need. Truck drivers, in particular, play a significant role in the national economy and are responsible for moving goods between and within cities and States. Large trucks account for only 4 percent of registered vehicles in the U.S., but they make up 9 percent of total vehicle miles traveled and accounted for 12 percent of total traffic fatalities in 2013.36 These large trucks share space on the roads with passenger vehicles, and have their own safety needs. Nationally in 2013, there were just under 4,000 people killed in crashes involving large trucks, and 71 percent of them were occupants of the other vehicle involved in the crash. However, large truck safety has improved over time. Between 2004 and 2013, the miles covered by large trucks increased by roughly 25 percent, while fatalities involving large trucks decreased by about 20 percent (from 4,902 to 3,906).37
Commercial trucks are not the only large vehicles on the roads. Transit vehicles occupy space on our roadways as well, though they typically serve pedestrians and bicyclists. Transit vehicles that share space with passenger vehicles also have unique needs and challenges. Many of the safety issues associated with transit vehicles are similar to those of large trucks. Bus operators have to consider how stopping in traffic impacts the flow and operation of the transportation system, and must also consider the safety of their passengers boarding and disembarking the vehicle.
Road designs that accommodate large vehicles can sometimes be directly at odds with designs that favor pedestrians and bicyclists. For example, a pedestrian is more comfortable crossing an intersection if the turns are very tight, where the distance between corners in minimized to shorten the walking distance and decrease the time in the roadway. Large trucks and buses, however, require a larger turning radius (when compared to passenger vehicles) in order to turn safely. When designing intersections for large trucks, designers are tempted to increase the amount of space in an intersection and widen the corners. This change will make the turn easier, but it will also be more uncomfortable (and possibly less safe) for pedestrians. As described previously, these trade-offs need to be assessed and discussed when planning road projects.
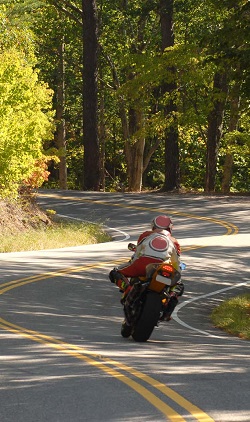
In recent years, motorcycling has become increasingly popular throughout the U.S. Since 2000 the number of registered motorcycles in the U.S. has nearly doubled.38,39 The result was a 71% increase in the number of motorcyclist fatalities (from 2,897 in 2000 to 4,957 in 2012).. Motorcyclists represented 15 percent of all traffic fatalities in 2012, compared to just 7 percent of fatalities in 2000.40 Motorcyclists are significantly overrepresented in traffic fatalities since they account for only 3 percent of registered vehicles and 0.7 percent of total vehicle miles traveled in 2012.41
In general, many of the roadway modifications done to improve safety for passenger vehicles can pose a challenge for motorcyclists. Rumble strips can be difficult to traverse, especially at low speeds. Guard rails, in particular cable barriers, can present a serious hazard to a motorcyclist impacting one at a high speed. Within the driving environment, motorcyclists are small compared to larger vehicles and can be difficult to see, specially early or late in the day when lighting levels are lower.
Walking is the most basic form of transportation. At some point during a typical day, nearly every person is a pedestrian. People walk to get to a bus station, to go from home to school, or to get from a parked vehicle to the front door of a business. Some walking trips are taken out of necessity—not all households own a vehicle,42 and children and individuals with disabilities may not have the option to drive. Many more walking trips are taken by choice, especially for exercise or health. A 2012 survey found that 39 percent of trips taken by foot are done for exercise or personal health purposes.43 Walking is also more common in densely populated urban areas, due to the close proximity of destinations and other services like transit stations.
Regardless of the reasons for walking, this mode accounts for nearly 11 percent of all trips taken in the U.S., according to the 2009 National Household Travel Survey (NHTS).44 The NHTS shows that about a third of all trips taken in the U.S. are shorter than one mile, and 35 percent of these trips are taken by foot. In the 2005 Traveler Opinion and Perception Survey (TOP), conducted by FHWA, data showed that about 107.4 million Americans (51 percent of the traveling public) use walking as a regular mode of travel.45
Pedestrians (along with bicyclists) are among the most vulnerable road users, and this is reflected in crash data. The 4,743 pedestrians killed in 2012 represented 14.1 percent of total traffic fatalities in the U.S. that year. Between 2008 and 2012, motor vehicle fatalities decreased 13 percent, while pedestrian fatalities increased 8 percent. Within the population of pedestrians, there are certain groups which are especially vulnerable. These include young children, older adults, and individuals with disabilities.
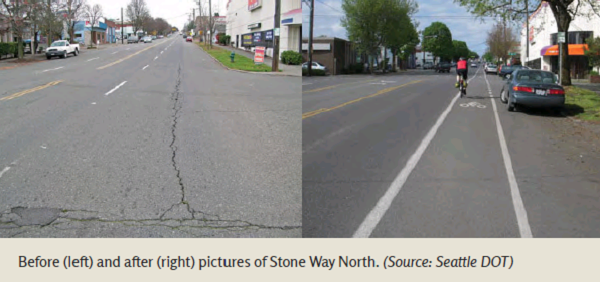
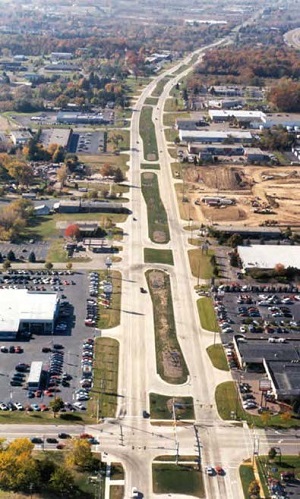
In 2008, Seattle Department of Transportation implemented a road diet on a 1.2-mile (1.9-kilometer) section of Stone Way North from N 34th Street to N 50th Street. In addition to serving motor vehicles, this segment of Stone Way North helps connect a bicycle path with a park. Within five blocks are eight schools, two libraries, and five parks.
The modified segment was originally a four-lane roadway carrying 13,000 vehicles per day. For this corridor, the city’s 2007 bicycle master plan recommended climbing lanes and shared lane markings (previously known as “sharrows”). The cross section reduced the number of travel lanes to add bicycle lanes and parking on both sides. The resulting corridor saw a decrease in the 85th percentile speed, while the overall capacity remained relatively unchanged despite the reduction in the number of lanes. The number of bicyclists on the corridor increased by 35 percent, but crashes involving bicyclists did not increase. Pedestrian crashes declined by 80 percent following the project.
Summarized from a 2011 Public Roads article:
http://www.fhwa.dot.gov/publications/publicroads/11septoct/05.cfm
Young children are a vulnerable road user group, and may be more likely than adults to rely on walking as a primary transportation mode—especially before they are old enough to drive. One area of concern is creating a safe environment for young children when they walk to school. Safety professionals need to ensure that sidewalks and street crossings have the appropriate measures to assist children in traveling safely, and educate children about safe walking.
Another vulnerable portion of the pedestrian population includes those who are blind or visually impaired. These pedestrians have increased challenges in navigating the road safely, particularly at street crossings. Challenges faced by a blind or visually impaired pedestrian include finding the appropriate crossing point at an intersection corner or midblock location, determining the appropriate time to cross, and crossing quickly and accurately. Both crossing and traversing a sloped sidewalk can be equally difficult for an individual in a wheelchair, where even slight cracks or bumps in the sidewalk can present major obstacles. The difficulties of these challenges increase at locations with unusual geometry, irregularly timed signals, or non-stop vehicle flow such as roundabouts and channelized turn lanes.
Older adults face many challenges as well. There are a number of age-related changes that affect the functional ability of older adults to safely walk and cross the street. These changes include diminished physical capability, sensory perception, cognitive skills and lag in reflexive responses. Eyesight deterioration can diminish an older person’s ability to see and read guide signs, slow their reaction time and decrease their ability to gauge a vehicle’s approaching speed or proximity.46
Drivers and pedestrians share responsibility for many pedestrian fatalities, as both parties attempt to navigate through the same space at the same time. Though we know that certain factors are likely to result in more severe pedestrian crashes, such as speed,47 no single cause stands out as the major contributor to pedestrian crashes. For this reason, no single countermeasure alone would likely make a substantial impact on the number of pedestrian crashes. A successful countermeasure program should use a mix of engineering, environmental, educational and enforcement measures to improve pedestrian safety.48
Bicyclists were some of the first users of U.S. roads, and the group that made the earliest push to improve road conditions. In recent years, bicycling has seen a rise in popularity for both recreation and transportation. Data from the 2009 NHTS showed that while only 1 percent of all trips are taken by bicycle, the number of bicycle trips doubled between 1990 and 2009.49
While bicyclists account for only 1 percent of all trips, the 726 bicyclist fatalities in 2012 represented 2 percent of all traffic fatalities that year.50 While the number of bicyclists killed has risen only slightly since 2008, the decline in motor vehicle deaths means that bicyclists account for an increasing share of total traffic fatalities.
Bicyclists face unique challenges as road users. More often than not, bicyclists share space with motor vehicles and are considered legal users of the road in most locations. Many potential bicycle riders are not comfortable sharing the road with heavy vehicular traffic and may be deterred from riding their bicycles. Intersections can also pose a challenge to bicycle riders when they include high volumes of turning traffic and a large number of lanes. These barriers to bicycling, busy street segments and intersections, often discourage potential riders even when the rest of a bicycle network is comfortable. Many bicyclists are willing to go out of their way to use a route that has lower vehicle volumes and speeds, or bicycle facilities that are separated from traffic. Safe bicycle facilities can also improve connections to shopping, transit, jobs, schools, and essential services.
Successful road safety programs will consider the needs of all users when planning and developing transportation projects. Each user group plays an important role in the transportation system, and each has unique safety needs that safety professionals must consider. Road user decisions are influenced by a variety of factors, and the combinations of factors that result in particular travel behavior cannot easily be categorized or understood in simple terms.
RSPCB Program Point of Contact
Felix Delgado, FHWA Office of Safety
Felix.Delgado@dot.gov
FHWA Office of Safety
Staff and Primary Work Responsibilities
FHWA Office of Safety
Safety and Design Team
FHWA Resource Center