|
Search the Noteworthy Practices database Florida Highway Patrol Pilots Signal Four Analytics, a Web-based Crash Mapping and Analysis Tool – FloridaOriginal publication: Signal Four Analytics, a Web-based Crash Mapping and Analysis Tool – Florida Highway Patrol (Website)Key AccomplishmentsTraffic crash data is available now in greater detail than ever, but making sense of this data remains a challenge to law enforcement, transportation planners, and traffic engineers. These professionals need powerful, accessible, and affordable tools to explore the spatial and logical relationships that drive decisions on resource allocation and project prioritization. Signal Four Analytics aims to address these needs by providing current crash and streets data paired with interactive analysis and visualization tools, accessible via any modern web browser. ResultsFlorida Highway Patrol (FHP) is currently the statewide pilot agency for this system. The GeoPlan Center and FHP are working together to ensure that the system will fulfill the crash analysis needs of law enforcement for identifying critical safety areas in order to apply enforcement education countermeasures effectively to reduce fatalities and injuries on Florida's roadways. Crash data—long and short form, collected electronically by FHP officers at crash sites throughout the state—is transmitted nightly to the GeoPlan Center and loaded into the Signal Four Analytics database. Live database statistics are shown above and to the right. Once the pilot phase is complete, Signal Four Analytics will be extended for use to interested traffic engineering, transportation planning, and other law enforcement agencies in Florida. 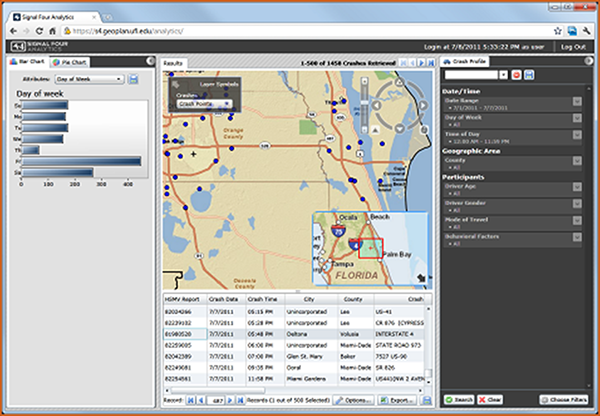
Figure 1. Signal Four Analytics Web Interface 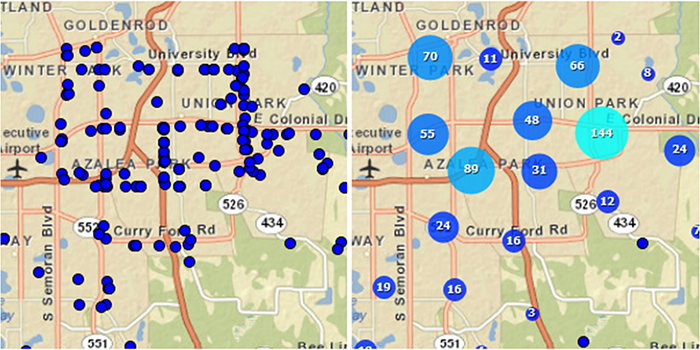
Figure 2. Crash data can be viewed spatially in the context of a map. The system can present the data as individual points, or collectively as clusters. The map views allow analysts to quickly gain an intuitive understanding of the spatial distribution of crashes. 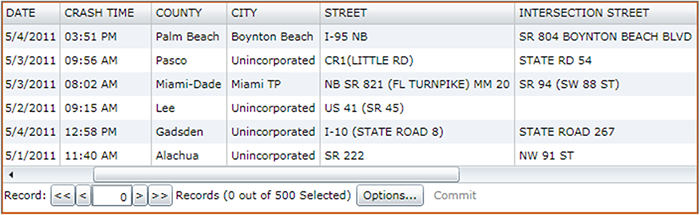
Figure 3. Crash attributes and derived statistics can be viewed in tabular format. Tables interact with the map view—as records are selected, associated points are highlighted on the map (and vice-versa). 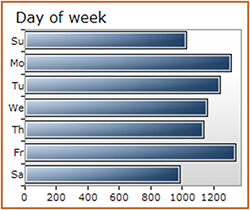
Figure 4. The distribution of crashes can be charted according to any number of attributes (day of week, for example). ContactMajor Richard S. Mechlin Dr. Ilir Bejleri |