|
Search the Noteworthy Practices database Nevada Builds Evaluation into its Strategic Highway Safety PlanThe Nevada practice is discussed after the following introduction about Strategic Highway Safety Plan (SHSP) evaluation.Other states in this SHSP Evaluation Noteworthy Practices series: ID and WA Publication Year: 2015Planning for Evaluation Should Begin When the SHSP is DevelopedThe Highway Safety Improvement Program (HSIP) requires States to evaluate their Strategic Highway Safety Plan (SHSP) to ensure the accuracy of their SHSP priorities and proposed strategies. Furthermore, evaluation helps States answer basic questions about the progress of their SHSP such as:
States that have successfully integrated evaluation into their SHSP process have realized the opportunity it provides to strengthen their SHSP efforts. Benefits include demonstrating the SHSP's contribution to transportation safety; uncovering challenges in prioritizing or implementing programs and strategies; determining progress in meeting SHSP goals and objectives, and; validating emphasis areas and strategies, or revealing the need to revise them. Following are examples of how States have put evaluation into action.
It is never too early to institute evaluation; in fact, planning for evaluation should begin when the SHSP is developed. During the early stages of SHSP development attention should be given to how progress will be measured and success determined. Nevada's PracticeSHSP Annual Report Helps Nevada Monitor Performance Measures ProgressImplementation Status for Strategy:
In 2012, Nevada's SHSP Critical Emphasis Area (CEA) teams adopted a series of performance measures to track the impact of strategies adopted by each CEA (for their 2012-2016 SHSP), all of which tie to the number of fatalities and serious injuries. The Nevada SHSP objectives were set as five-year average number of fatalities and serious injuries with 2008 (average of 2004 to 2008) as the baseline year. Nevada compiles their results into an Annual Report. The report shows progress for their performance measures and supporting data. It also summarizes the activities implemented to support the SHSP strategies. The shaded content is an excerpt from Nevada's January 2013 Annual Report for their Pedestrian critical emphasis area. They document their safety progress towards a reduction in fatalities and serious injuries as well as provide the implementation status of their strategies. Safety Progress on Pedestrians Fatalities and Serious InjuriesBetween 2008 and 2011, pedestrian fatality numbers dropped by 23.2 percent and serious injuries decreased by 29.7 percent (Figure 3). The five year average number of pedestrian fatality and serious injuries both ended up lower than their targets (Figure 4). Figure 3. Pedestrian Fatalities and Serious Injuries 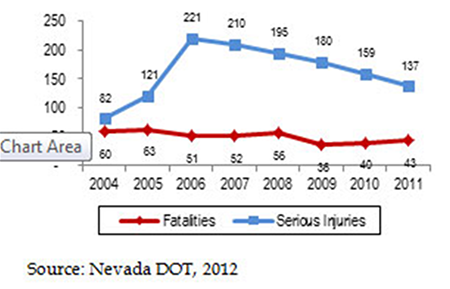
Figure 4. Five Year Average Pedestrian Fatalities/Serious Injuries 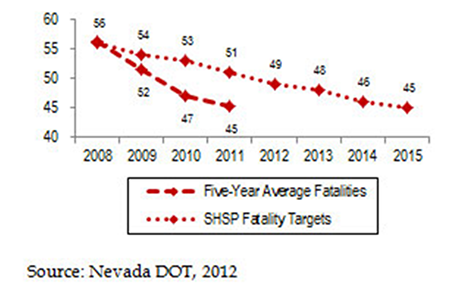
See these other SHSP Evaluation Noteworthy Practices:ContactKen Mammen Publication Year: 2015 |