|
Search the Noteworthy Practices database Interoffice Safety Groups at Washington State DOT Use Quantitative Data Evaluation to Determine Strategies Across the “4Es”Original publication: Safety Data Decisionmaking at WSDOTPublication Year: 2014BackgroundUnique among State Departments of Transportation, the Washington State Department of Transportation (WSDOT) does not have a centralized safety office. Rather, safety is central to decisionmaking across the agency; the offices of planning, traffic operations, design, risk management, and maintenance all work together to build and maintain safe roadways in the State. The agency's State-level highway safety program is coordinated by three cross-cutting groups: the Highway Safety Executive Committee, the Highway Safety Working Group, and the Highway Safety Issues Group. The PracticeWSDOT relies upon these three cross-cutting groups to ensure that expert judgment guides the transportation planning and project selection process in Washington State. These three groups play an important role in identifying the State’s safety needs and providing guidance to WSDOT regional offices in support of safety project selection. BenefitsOne key benefit of WSDOT's interoffice safety groups is their focused ability to address the factors contributing to crashes using a “4E” approach, which uses quantitative data evaluation of contributing factors to crashes to determine appropriate engineering, education, enforcement, and emergency medical services strategies. This interoffice approach enables the agency to target statewide safety priorities by coordinating activities between various parts of the agency, including: programming, design, traffic operations, risk management, and maintenance. Due in part to the State's safety-related innovations, Washington has observed a continued reduction in the number of fatal crashes. In fact, Washington State has averaged 22 fewer traffic fatalities and 80 fewer serious injuries each year between 2002 and 2011 (see Figure 1). WSDOT anticipates that, with continued highway safety improvements, this figure will continue to decline. 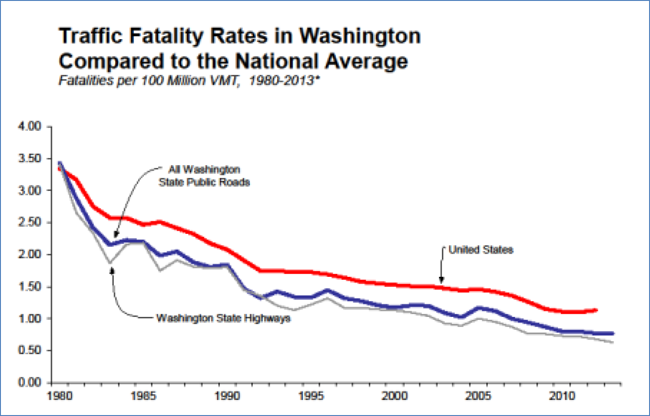
Figure 1: Traffic fatality rates in Washington compared to the national average. (Courtesy of WSDOT) Publication Year: 2014 |