|
Search the Noteworthy Practices database Ohio DOT Implements New Roadway Safety Management Process with AASHTOWare SafetyAnalyst™Original publication: Highway Safety Manual Case Study 2: Implementing a New Roadway Safety Management Process with AASHTOWare Safety Analyst™ in OhioPublication Year: 2010ODOT's use of AASHTOWare Safety Analyst™ (SA) allowed it to develop multiple screening methods in the network screening process resulting in greater identification of rural corridors and projects. IssueApplication of the Highway Safety Manual (HSM) and related safety data tools. Key Accomplishments“Ohio DOT is excited about the opportunities that SA provides the highway safety engineering community by allowing the end users to easily perform network screenings and countermeasure evaluations with a high level of statistical rigor.” – Jonathan Hughes, ODOT
ResultsApplying various HSM screening methods identified ways to overcome some of the limitations of existing practices. For example, the agency's previous mainframe methodology typically over-emphasized urban “sites of promise,” or those locations identified for further investigation and potential countermeasure implementation. Benefits
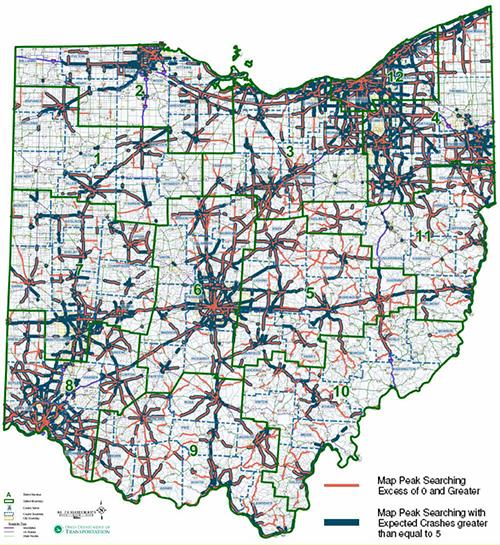
Figure 1: GIS Display of Expected and Excess Crashes for Highway Segments ContactJonathan Hughes, P.E. Publication Year: 2010 |