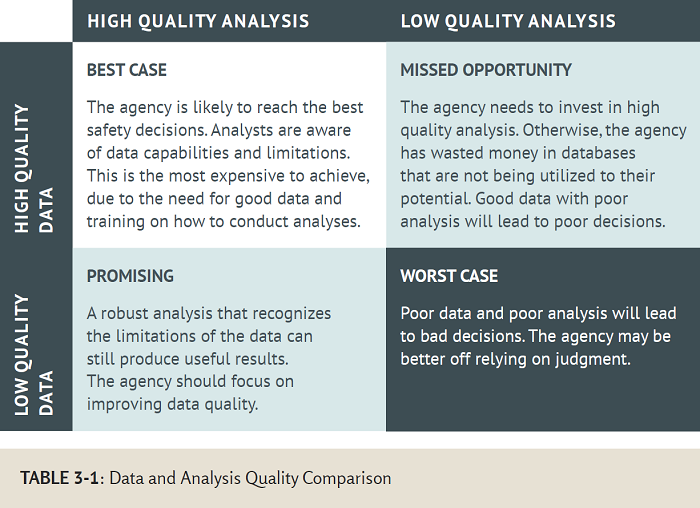
| High Quality Analysis | Low Quality Analysis | |
|---|---|---|
| High Quality Data | Best Case The agency is likely to reach the best safety decisions. Analysts are aware of data capabilities and limitations. This is the most expensive to achieve, due to the need for good data and training on how to conduct analyses. |
Missed Opportunity The agency needs to invest in high quality analysis. Otherwise, the agency has wasted money in databases that are not being utilized to their potential. Good data with poor analysis will lead to poor decisions. |
| Low Quality Data | Promising A robust analysis that recognizes the limitation of the data can still produce useful results. The agency should focus on improving data quality. |
Worst Case Poor data and poor analysis will lead to bad decisions. The agency may be better off relying on judgment. |
RSPCB Program Point of Contact
Felix Delgado, FHWA Office of Safety
Felix.Delgado@dot.gov
FHWA Office of Safety
Staff and Primary Work Responsibilities
FHWA Office of Safety
Safety and Design Team
FHWA Resource Center