Photo credit: Earl Walker © 123RF.com
Local road authorities submitted requests to Illinois DOT (IDOT) for assistance in evaluating road safety issues. IDOT’s Bureau of Safety Programs and Engineering (BSPE) provided funding and technical assistance from in-house safety specialists to conduct a large number of Road Safety Assessments (RSAs) along local road systems. The final product was a prioritized list of key findings and recommendations.
BSPE prioritized requests based on three factors (Sheehan, 2017, pers. comm):
Selected sites to be evaluated through an RSA focused on identifying the locations with the potential for the largest impact on the most critical fatal and severe injury crashes. Once locations were selected, the RSAs were conducted following U.S. Federal Highway Administration’s (FHWA) guidelines (https://highways.dot.gov/safety/data-analysis-tools/systemic/road-safety-audits-rsa). At selected RSA sites, the BSPE assembled an independent and multidisciplinary team including IDOT, FHWA, and the Illinois State
Local public agencies participated in the RSA kick-off meetings to provide the RSA team with relevant information about the selected site. Local agencies also participated in a close-out meeting.
The RSA team answered critical questions about the selected locations, diagnosed safety issues, and identified opportunities to eliminate or mitigate the local agency’s safety concerns. The team also presented project recommendations for locations that the local agency would otherwise not have been able to address.
Examples of requests for RSA assistance approved by the BSPE included:
For all RSAs, BSPE’s technical expertise has resulted in project recommendations for key locations.
Filiberto Sotelo
Illinois Department of Transportation
(217) 557-2563
Safety specialists have successfully conducted RSAs along local Illinois road systems. To obtain safety specialist support, an agency could:
The Minnesota Department of Transportation (MnDOT) pioneered new methodologies to supplement their traditional hot-spot/high-crash location analysis based on crash frequency using a systemic analysis based on crash potential. These methodologies were first described in MnDOT’s 2008 Strategic Highway Safety Plan (SHSP). North Dakota DOT (NDDOT) adapted the Minnesota process to fit North Dakota’s needs and developed a Local Road Safety Program (2013-2015). The system-wide crash analysis processes can be applied to other local agencies if their crash analysis experience and resources are limited.
Figure 10-1. Minnesota County Roadway
Systemic Safety Planning Process

The SHSP (MnDOT, 2008) presented four findings from the system-wide crash analysis, illustrating the importance of incorporating local road systems into broader safety planning efforts:
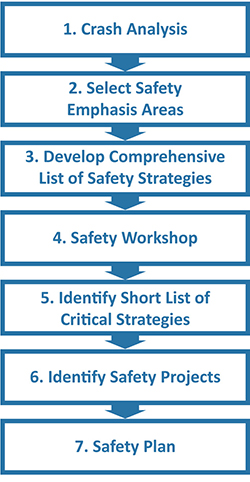
MnDOT, assisted by Minnesota’s county engineers and the U.S. Federal Highway Administration (FHWA), developed a plan to integrate local systems into its statewide safety program. MnDOT dedicated HSIP funding to exclusively support local road improvements and provided each county with technical assistance to conduct a data-driven systemic assessment and prepare a County Road Safety Plan. MnDOT’s seven-step systemic process (Figure 10-1) evaluated each county’s roadway system, based on attributes common to locations with crash histories and responses to the following three questions.
MnDOT applied the systemic safety planning process to each of Minnesota’s 87 counties. Table 10-1 summarizes the program study network for the county road system.
Table 10-1. Program Study
Network Summary
(Minnesota County Roadway System)
| Rural | Urban | |
|---|---|---|
| Roadway Miles | 27,000 | 1,600 |
| Horizontal Curves | 19,000 | N/A |
| Intersections | 13,000 | 2,900 |
Key findings from the analysis include:
Figure 10-2. Example of a Visual Trap – Minor Road Intersects Roadway on a Curve

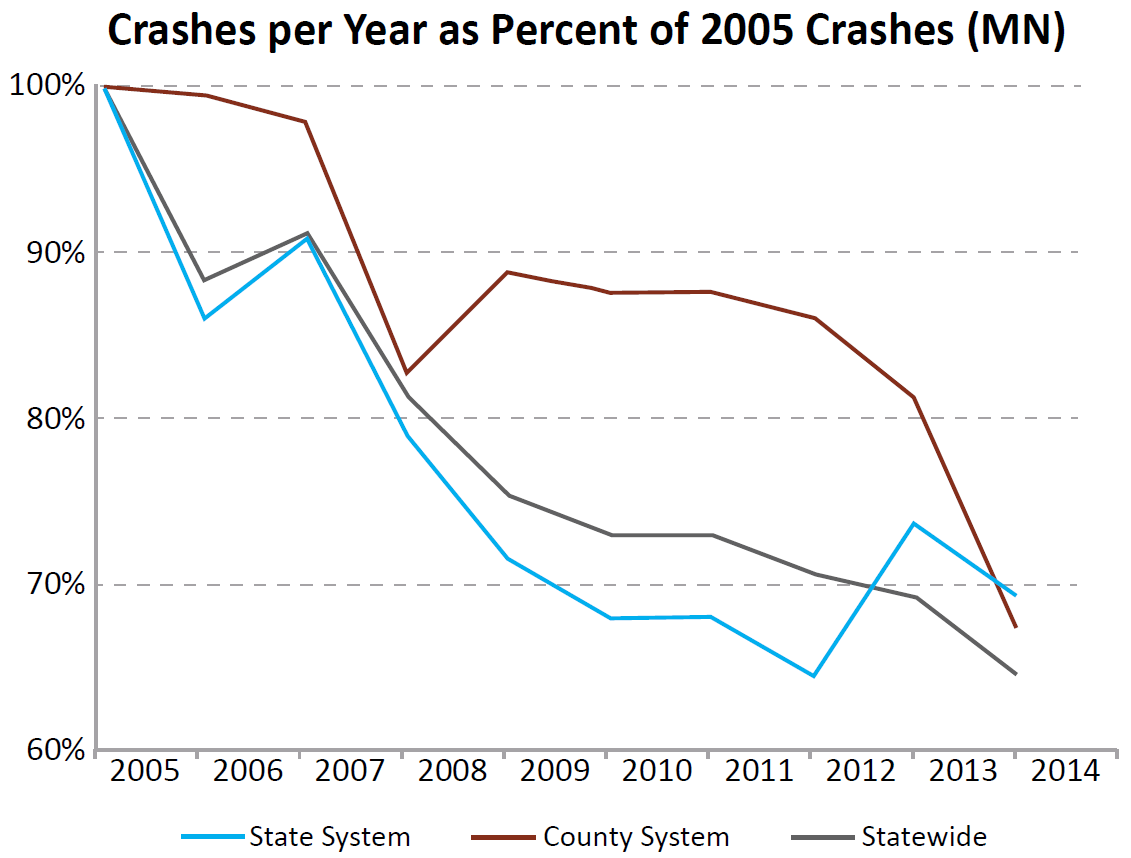
MnDOT has implemented a successful system-wide safety analysis. Since completing the County Road Safety Plan project in 2012 (MnDOT, 2018), MnDOT has met its goal of appropriating approximately $15 million per year in HSIP funds for the deployment of safety improvements throughout the county system (approximately $75 million to date). Almost 85% of Minnesota’s counties have had at least 1 safety project funded (1 county has already implemented safety projects worth more than $7 million (Vizecky, 2017, pers. comm). A recent evaluation of statewide fatalities found a 25% reduction throughout the county system since 2011 (Vizecky, 2017, pers. comm) when MnDOT first set aside HSIP funding for local system safety improvements (Figure 10-3).
Figure 10-3. Minnesota Fatality Trend Line

Source: Minnesota Roadway & Crash Data Facts 2005-2014; Adapted by FHWA
North Dakota’s SHSP (NDDOT, 2013) highlighted the following safety facts:
In view of these findings, NDDOT committed to support goals to increase local agency participation in the statewide safety planning process and dedicated HSIP funds to improvements on local roads (NDDOT, 2013).
However, NDDOT recognized that majority of local agencies had insufficient staffing and limited experience conducting the kind of data-driven analysis required to develop HSIP-eligible safety projects.
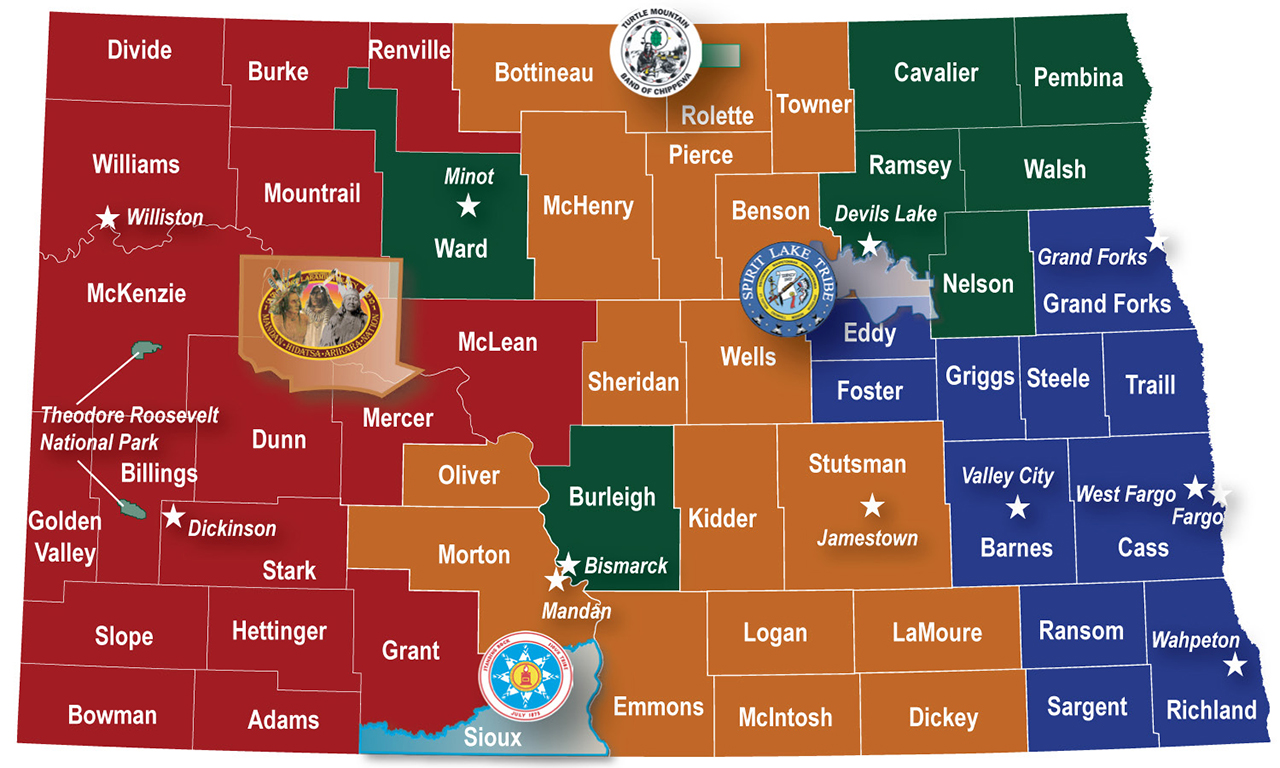
To address these concerns NDDOT initiated a Local Road Safety Program in which NDDOT partnered with local agencies to conduct a system-wide safety analysis and prepare safety plans for 53 counties, 12 major cities, 4 sovereign reservations, and 1 national park (Figure 10-4). North Dakota’s local road system encompasses more than 79,000 miles of the state’s approximately 107,000 miles. Historically, about 50% of severe crashes have occurred on local roads, but the density of these crashes was very low (0.002 severe crashes per mile per year). Prior efforts (studies, investigations, and projects) failed to identify high-crash locations along local roads based on traditional analysis methods that relied heavily on crash density. This has meant local agencies have been unable to identify HSIP-eligible safety projects.
To find out more about the high percentage of severe crashes occurring on NDDOT’s local roads, NDDOT implemented an alternative systemic assessment using road and traffic characteristics to identify, evaluate, and prioritize at-risk locations to consider for safety investment. Because this type of systemic assessment was in line with FHWA guidance, NDDOT expanded the scope of its HSIP policy—which previously only included projects identified through traditional site analysis—to include projects identified through the systemic analysis of local roads. NDDOT also determined that neither DOT staff nor local agencies had experience applying the systemic approach to safety and allocated $1.5 million to fund the systemic assessment of the local system and preparation of 70 safety plans.
Figure 10-4. North Dakota Counties, Cities, Reservations, and National Parks

Source: NDDOT, 2015
The systemic risk assessment addressed both rural and urban local roads and focused on two types of key roadway facility types: rural paved (county, tribal, and national park) and urban arterials/collectors in North Dakota’s larger cities (i.e., 5,000 population). Rural paved roads were selected for analysis based on statewide crash data that showed even though rural paved roads accounted for less than 10% of the local roads, they accounted for approximately half of all severe crashes on local roads. Further analysis indicated that on these rural roads, the most at-risk elements in severe crashes were:
Major cities in North Dakota (considered cities with a population of 5,000) were selected for systemic risk assessment because approximately 90% of severe crashes on local roads in urban areas occurred within the 12 cities with populations exceeding 5,000.
NDDOT used a data-driven systemic safety analysis approach to prepare the safety plans for the local agencies by identifying priority crash types and effective, low-cost safety strategies and prioritizing locations along the local road system. NDDOT prepared individual safety plans documenting the strategies that could be deployed at specific locations for each of the counties, cities, tribes, and national parks. Each plan addressed the typical barriers local agencies face when implementing HSIP projects, including:
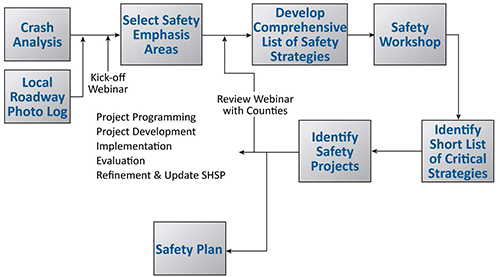
Figure 10-5. Systemic Safety Project Development Process Flow Chart

Source: NDDOT, 2015
Safety projects generated from the Local Road Safety Program (Figure 10-5) were consistent with the priorities in North Dakota’s SHSP and eligible for HSIP funding.
NDDOT considers participation in the HSIP voluntary. If local agencies choose to participate, they must:
One goal for NDDOT was to identify low-cost projects that deployed safety strategies across the highest number of at-risk locations throughout North Dakota’s local road system. The local safety plans identified approximately 3,000 individual projects with a total estimated implementation cost approaching $55 million. The average project cost was around $18,000. NDDOT also looked into increasing the level of local agency engagement in the statewide safety planning process and into funding more local agency projects. The first HSIP developed after completing the Local Road Safety Program contained 15 projects submitted by local agencies (they were identified as part of the Program) valued at almost $5 million, representing approximately 35% of the Safety Program budget.
To assist local agencies when applying for funding, the safety plans included a project sheet for each project. These sheets accomplished two key objectives:
Feedback on the local and state levels is very positive. For local agency staff the project sheets have simplified the HSIP process. For NDDOT staff submissions using the project sheets are complete, accurate, and require no additional effort to make corrections or search for missing information.
MnDOT and NDDOT successfully developed safety plans using processes that can be applied by other state DOTs with less experienced staff or unused resources. Both agencies modified their SHSP process so that systemic analysis of the local roadway system could be used as a baseline for HSIP funding requests. Each agency has also prepared local road safety plans to help local agencies navigate the HSIP process and apply for local system project funding. To develop a safety plan, a local agency could:
Mark Vizecky
Minnesota Department of Transportation
(651) 366-3839
Karin Mongeon
North Dakota Department of Transportation
(701) 328-4434
RSPCB Program Point of Contact
Felix Delgado, FHWA Office of Safety
Felix.Delgado@dot.gov
FHWA Office of Safety
Staff and Primary Work Responsibilities
FHWA Office of Safety
Safety and Design Team
FHWA Resource Center